

Geospatial technologies can inform your solutions by unlocking hidden patterns and trends within national and local populations, combining multiple data sets, and providing valuable insight
Helping you see the bigger picture and make the right decisions
Our cancer screening solution can support you across the following programmes:
Operational efficiencies for you, your team and your PCNs – easy to use, powerful technology saving time and improving accuracy.
Easy to understand data visualisations – Speeds up the process, is more accessible and enables you to gain buy-in for your solutions - with compelling data visualisations and impressive data layering.
- Bowel cancer
- Cervical cancer
- Breast cancer
Operational efficiencies for you, your team and your PCNs – easy to use, powerful technology saving time and improving accuracy.
Easy to understand data visualisations – Speeds up the process, is more accessible and enables you to gain buy-in for your solutions - with compelling data visualisations and impressive data layering.
How has Sussex bowel screening become more focused?
Bowel cancer is the fourth most common cancer in the UK and the second biggest cancer killer. Our geospatial team was engaged by Sussex Integrated Care System (ICS) to identify hotspots of low bowel s...
What our bowel, breast and cervical cancer dashboards do:
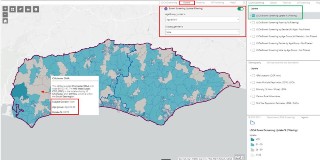
- The easy-to-use operational tool visualises screening uptake and coverage rates by GP practice across the system for specific cancer cohorts.
- Refreshed quarterly with FutureNHS data to keep it current.
- Identifies GP practices with low screening uptake rates across individual and multiple programs allowing you to focus on hotspot areas or practices of concern.
- Includes a time series analysis of screening against uptake by GP practice to assess performance and show the impact of interventions.
- Filterable visualisations allow easy interrogation of the data to suit your needs.
- Datasets can be exported for further analysis.
- Includes census data to assist in addressing low uptake in areas with the highest deprivation or ethnic diversity to support addressing health inequalities.
- Uses contextual layers such as cancer incidence, two-week wait referrals, health and postcode boundaries, and locations of healthcare services to allow you to make sense of the data for your own requirements.
Addressing cancer screening and health inequalities
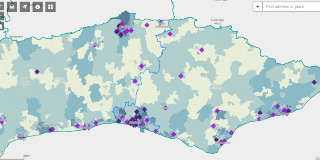
Image: Map showing screening coverage across multiple programmes at GP practice level
Our cancer screening dashboards actively support ICBs with your Core20Plus5 priorities and the delivery of the PCN Direct Enhancement Service (DES).
Our cancer screening dashboards actively support ICBs with your Core20Plus5 priorities and the delivery of the PCN Direct Enhancement Service (DES).
How we can help
1
Interactively visualises population demographics, Indices of Multiple Deprivation and ethnic diversity data
2
Visualises cancer screening uptake performance at GP practice level
3
Identifies GP practices facing the challenge of lower screening rates and high deprivation
4
Assists GP practices in the identification of surrounding areas that may benefit from targeted screening interventions with functionality that allows users to overlay screening data against deprivation statistics and postcode boundaries
Tracking cancer screening uptake over time

Image: Two colleagues reviewing data on-screen
We can help Cancer Alliances and ICBs track progress in increasing cancer screening in line with the delivery of the PCN DES for Early Cancer Diagnosis.
We can help Cancer Alliances and ICBs track progress in increasing cancer screening in line with the delivery of the PCN DES for Early Cancer Diagnosis.
How we can help
1
Screening uptake is mapped by GP and by PCN and visualised for easy identification of locations with low uptake rates
2
Filters allow you to drill down to individual PCNs or GP practices and show locations of low performance only
3
Data is refreshed quarterly allowing the user to track progress over time and assess the success of cancer screening interventions
4
Contextual layers such as postcode areas and demographic indicators can be utilised in conjunction with the specific eligible cohort age groups to efficiently and cost-effectively identify areas with little progress for further interventions
Bowel cancer screening – targeting high-risk geographic areas
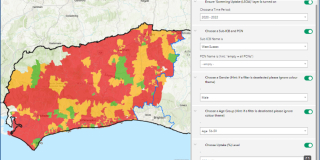
Image: Map showing screening uptake by LSOA
We also offer a detailed Bowel Screening Application mapping uptake and positivity at Lower Super Output Area (LSOA), using data provided from the Bowel Screening Programme Hub activity.
We also offer a detailed Bowel Screening Application mapping uptake and positivity at Lower Super Output Area (LSOA), using data provided from the Bowel Screening Programme Hub activity.
How we can help
The application allows you to drill down to highly localised areas and interrogate rates of bowel cancer positivity and uptake by age and gender for detailed targeting.
1
Interactively visualises bowel cancer uptake and positivity rates across the system
2
Heatmaps display patterns of screening uptake rates
3
Filters focus the display and data by geographic area, time period, age, gender, uptake level
4
Provides a time series view of screening uptake and positivity rates
5
Two geographic levels – LSOA (Lower Super Output Area), Primary Care Network
6
Contextual layers include hospitals, community diagnostic hubs, GP practices, pharmacies, care homes, deprivation indicators, ethnicity indicators, and rural/urban areas
7
The dataset can be displayed in two-yearly screening rounds
Geospatial consultancy services
We're here to help you tackle your biggest challenges and solve your location-based problems.
This email address is being protected from spambots. You need JavaScript enabled to view it. .
- Supporting the reconfiguration of breast screening sites
- Mapping fixed and mobile site locations
- Mapping allocation of screening sites to GP practices
- Conducting travel accessibility analysis to screening sites
- Support age extension of the bowel screening programme to 54 and 55-year-olds when data is available in FutureNHS
- Investigate cancer incidences and mortality by age group
- Bespoke location analysis and mapping to suit your cancer screening and wider business needs
- Facilitating workshops using geospatial visualisations to support decision-makers
Testimonials and comments on our work

Cancer and long-term conditions
Delivery of the NHS Long Term Plan ambitions for cancer by 2028 will include improving our national screening programmes, giving people faster access to diagnostic tests, investing in innovative treat...

Geospatial services
Our team of Geographic Information System (GIS) specialists provide geospatial services to support ICBs, NHSE and numerous NHS Hospital Trusts and other organisations. We often work collaboratively wi...

Geospatial solutions to support Primary Care commissioning
Our geospatial consultants are experts in creating location-based solutions that layer population and health data to visualise trends, unlock patterns and reveal insights.
...
Contact the team
If you'd like to find out more about how our Geospatial team can help you, please complete the form and we'll be in touch very soon.